Getting A Feel For Future Fire
The time for a National Fire Data Centre is well past due
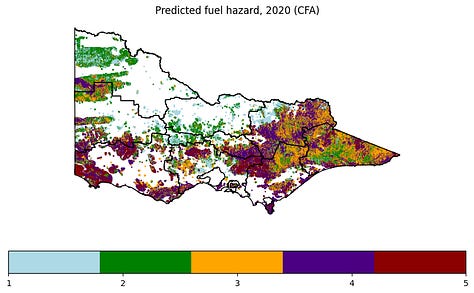
With the help of the wizards at the Melbourne Data Analytics Platform, and Paul Bentley from FLARE Wildfire Research, we have whipped up a prototype website. I will share here a few screenshots, and tell you a bit about where we’re coming from, and what we need from YOU.
The idea: a simple, clear and elegant website that shows
Fire activity data
Fire driver data (fuel, dryness, weather and ignitions)
A few useful concepts
When people ask me who the site is for, I cannot answer. All I can say is that I would like to share some simple data-driven figures to help people think about fire. I don’t want people overwhelmed by choice. I don’t want a map with 100 layers that can be turned on and off. I am very much inspired by the set of plots that the Bureau of Meteorology keeps up its sleeve at its Climate and Past Weather site. And it would be useful to include not just maps and graphs, but a few concept / schematic figures and words about some key ideas for thinking about fire.
I’m not expecting this to become an ‘official’ site. But my dream is for some clever people to see it and be inspired to make something much better.
Frankly, the time for a National Data Centre for Bushfire is well past due. A Bureau of Fire, if you will. I have long held this conviction and I am not the only one. So consider this my guerilla campaign to win hearts and minds in this battle. I know that the reality is far more complex than these figures suggest. I know that knowing these figures and knowing fire are two very, very different things. But I’m still convinced that it would be useful for more people to have a sense of fire’s patterns in space and time, and that simple figures like these could help to build that sense.


And some more…


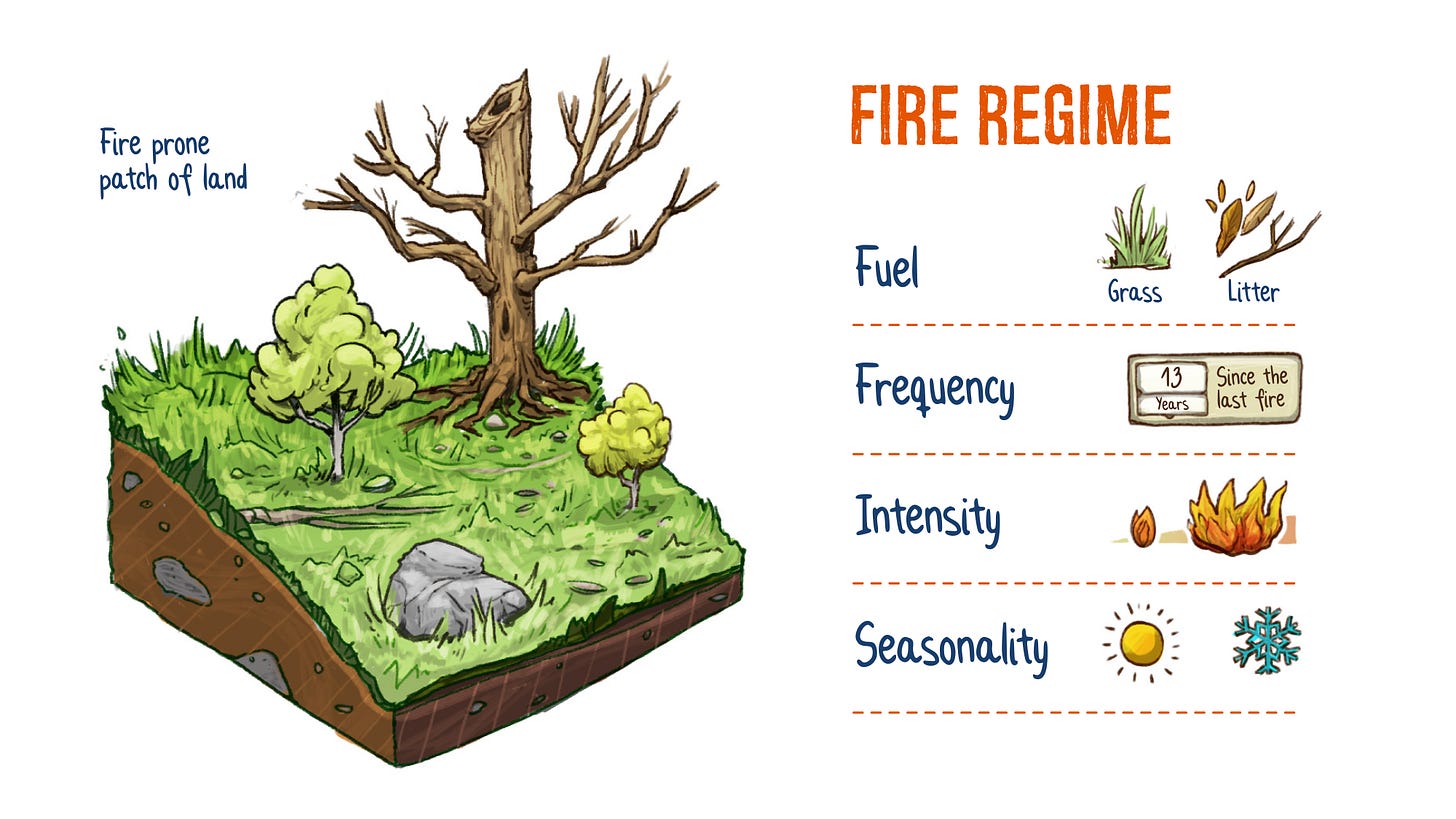
We also have a concepts page, which will soon be updated with this beauty from designer David Shooter …
The site is not live yet, and there are many kinks to iron out, from data glitches and dodgy axis labels, to opaque descriptions, clunky layouts and curious curation. It’s just the state of Victoria at this point. Still, I’m pretty chuffed with how far we got on the smell of an oily rag last year, and cautiously excited about what we can achieve this year. That’s right, I struck gold twice, and we got some funding to continue this work in 2024.
The Ask
So onto the ask for you, Dear Reader: Please share your thoughts!
I’d love to know what you would like to see and what you wish never to lay eyes on, when it comes to fire data. Note that I haven’t bothered with proper axis titles, legends and so on in the above grabs. There is a bit more detail on the actual site, but it is not live yet. Just know that we aim to show fire activity (from both satellite and agency sources), and a measure of fuel, dryness, fire weather and ignition likelihood. We aim to show it in maps, and in time series which show its trajectory over time. We also have some plots that show the trajectory of an individual fire season, and where that season sits within the long term record of fire seasons. And we want to share a few concepts, like the fire regime, the drivers of fire and risk.
So please, gimme some thoughts.
If you are really keen, get in touch with me and I will share the site details so you can look at it in your own time and perhaps give more detailed feedback.
And if you have seen other attempts to visually portray something of the nature of fire - in a book, on the web, or wherever - I’d love it if you shared links or citations to those too, and told me what you do and don’t like about them.
Postscript 1
The Friday before last I received an invitation from fire and climate science superstar Matt Jones to help co-author a State of the Wildfires report, which aims partly to document and communicate fire activity on a global scale. I have said yes to too many things, but I said yes to this with little hesitation because it seems to me to be a prime opportunity to continue the effort to communicate something of the dynamic nature of fire, at least from a data- and science-centric perspective. I’ll hopefully share some of what we produce here at Future Fire over the next few months.
Postscript 2
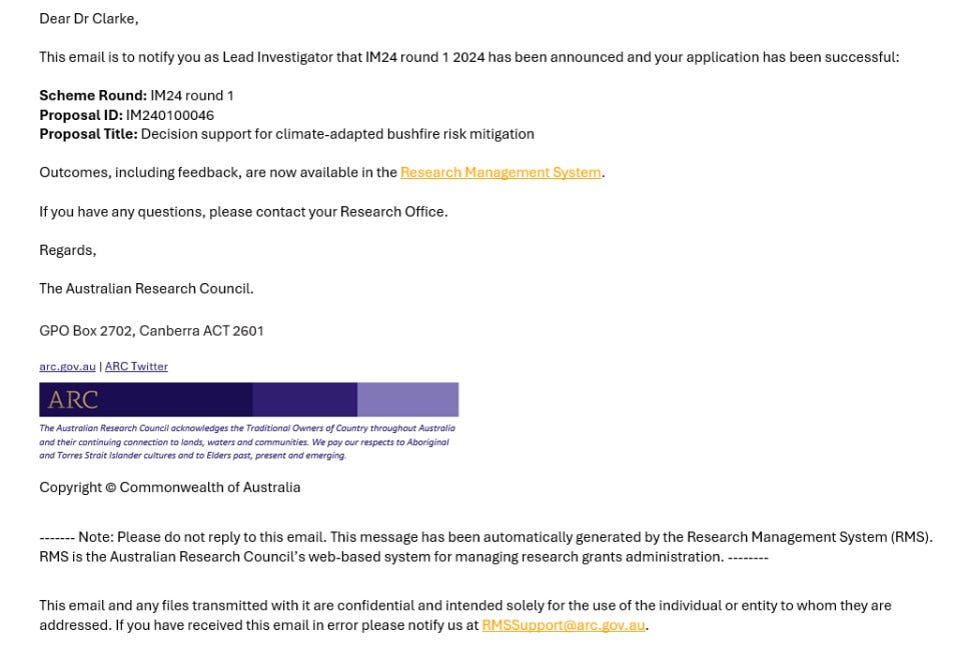
I received another email last Friday which cut to the core of me. I found out that my application for an ARC Mid-Career Industry Fellowship was successful. This means that they will give me (well, my salary and project) $1.15m over four years. I’ll be working with DEECA, CFA and NHRA to whip up some decision support for climate-adapted bushfire risk mitigation. My first reaction was to read, then re-read, then re-re-read the sparse announcement email:
Surely they could add some colour, an emoji, an exclamation mark? In quick time I was flooded with very kind words from colleagues, many of whom are highly attuned to grant announcements and so know exactly where to look when they come out. I spent the rest of the day, and week if I’m honest, in a bit of a daze. I’m very grateful for the success, very aware of my good fortune and privilege in getting to this point. And if I’m even more honest, I’m reminded of Jerry Seinfeld and Larry David’s remarks, when Seinfeld kept being renewed - basically they thought it was a disaster, because they would have to keep working, have to keep coming up with new ideas. I don’t have the talent or wealth of those two legends of comedy, but my Even Steven nature took some colleagues aback, who were expecting more of an outpouring of emotion. Oh well. 🥳


Congrats!
Congatulations on the grant Hamish. I'm sure the project collaborators will tell you want they want at some point !
And yes collaborating on the paper is obvious. Sometimes you get lucky (and have to work too).
Is the website part of an ARDC project ? I was linked in to a suite of projects on gathering/organisation/presenting national fire data some time ago and there was one involving the UoM Data group to host/link/present national fire data ... yes there needs to be a place for researchers & others to source reliable and consistent fire data. This is a challenge to achieve as most fire data is collected by States and there are only a few agreed standards (mostly to meet how State Agencies need/use the data, not how researchers may want to see/use it). Also 'someone' needs to aggregate, process/standardise the data.
Happy to chat more.
Mike W.